In the world of stock market, one thing is very important and useful, and that is technical analysis. This is very crucial, and Candlestick patterns are particularly significant. We may learn about the direction of the market and possible price movements from candlestick patterns. The Bullish Harami Candlestick pattern, which is regarded as significant reversal pattern, is one of these important patterns. It can be helpful for to comprehend the Bullish Harami pattern if you are an investor or interested in trading.
This important post will go into great length on the Bullish Harami Candlestick pattern, including what it is, how to spot it, and how using it might improve your trading decisions.
Ι What Is Bullish Harami Candlestick Pattern

The bullish Harami candlestick pattern is a very important part of technical analysis. This is a double candlestick pattern which is created with the help of two candles. Harami is a Japanese word, which means “pregnant”. The name of its bastard is due to its shape, because the second candle in the pattern looks like a candle in a mother’s stomach. This is a bullish reversal pattern which is formed at the bottom of the chart and after its formation the market moves in the upward direction.
Bullish Harami pattern is formed with the help of two candles:
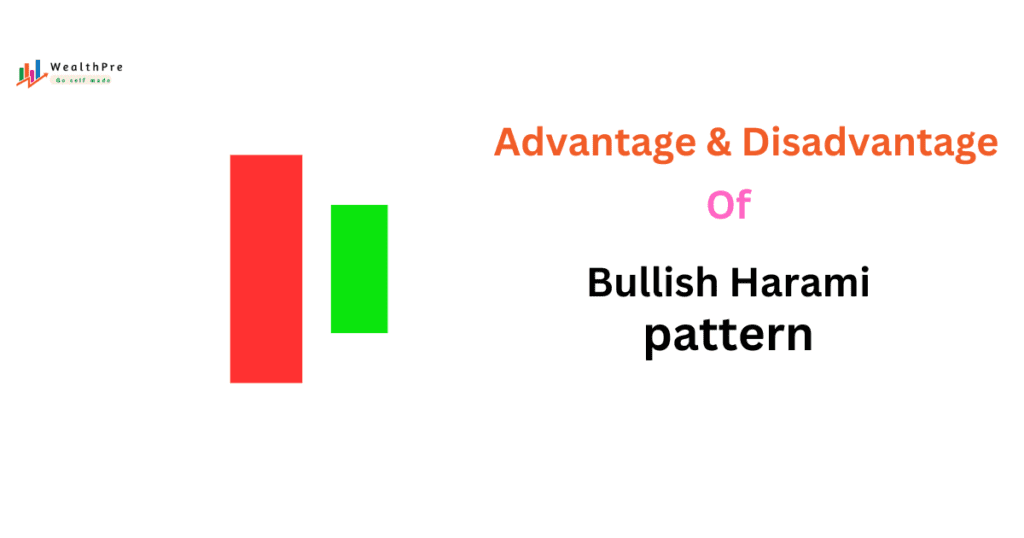
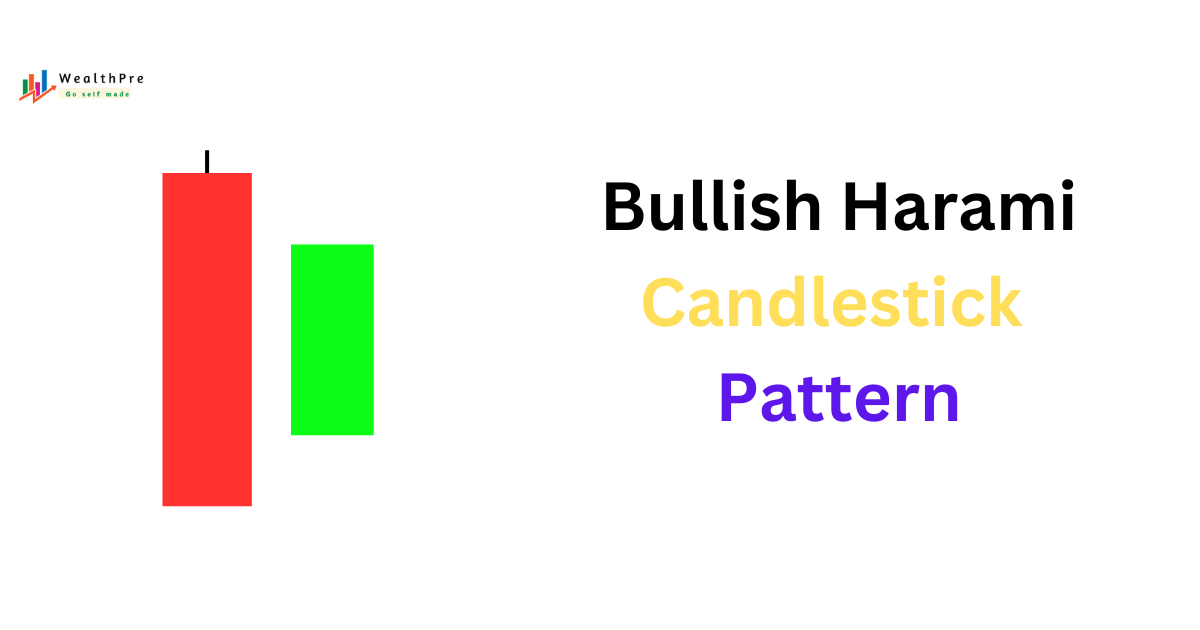
- First Candle: The first candle of the bullish Harami candlestick pattern is a large bearish candle, which shows that sellers were dominant in the market at the time of the candle’s formation. And due to this the market prices fell.
- Second Candle: The second and last candle of this pattern, a bullish candle, is essentially a green candle, shaped so that it completely fits into the body of the first red candle. The closing of this candle means that the market is now being supported by buyers and the dominance of sellers is decreasing. Which is a bullish signal.
Ι Psychology behind the formation of Bullish Harami pattern
There is a lot of downside mentality before forming a bullish harami candlestick pattern. If we look at this pattern carefully, the first candle of this pattern is a big red candle which indicates that there are a lot of sellers in the market at the current time. And the next candle of the pattern is a green candle until its formation occurs exactly in the middle of the first red candle, which indicates that now the pressure of sellers is reducing in the market and buyers are coming back.
Thus, the main purpose of the Bullish Harami candlestick pattern is to indicate that due to lack of sellers and mixed pressure from buyers, the market which has been in a downtrend for a long time is now likely to reverse its direction. Therefore the bullish Harami candlestick pattern becomes a very important pattern, which signals a change in trend.
Ι Example Of Bullish Harami Candlestick Pattern
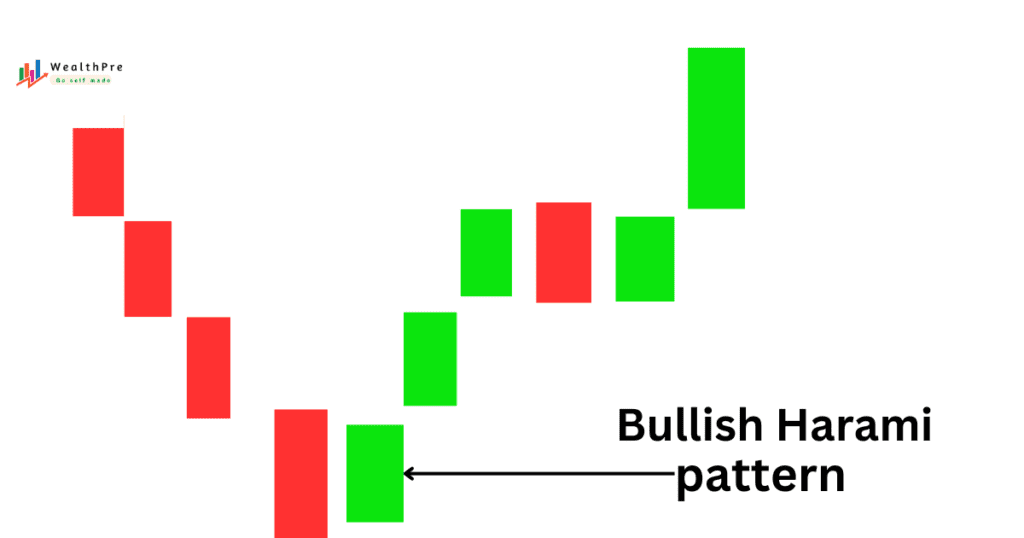
Let’s say that a company’s stock chart has been steadily declining over the past few days in the daily chart frame. This indicates a decline in prices and a dominance of sellers. One day, the market is declining and you see a lengthy bearish candle (red in colour) on the chart. The next day, a minor bullish candle (green in colour) is formed, which is entirely absorbed by the first bearish candle. This candle indicates that buyers are entering the market and sellers’ power in waning.
Now, if you notice another bullish candle on the third day and the price begins to rise, this confirms the Bullish harami candlestick pattern, which suggests that the market is about to cease its slump and begin an uptrend.
Ι How to recognize the Bullish Harami candlestick pattern on charts
The bullish Harami pattern is a double candlestick pattern which is formed with the help of two candles. This is easy to spot on the chart, but it requires a little effort. To recognize the bullish Harami candlestick pattern you can pay attention to the following signs:
1. First candle
The first candle of this pattern should be a large red candle, which shows the influence of sellers present in the market. This candle indicates that at the moment sellers have become dominant in the market due to which the price of the market is falling.
2. Second Candle
The second and last candle of the bullish Harami candlestick pattern should be smaller and green compared to its first red candle. And its structure should be such that it completely matches the inside of the first red candle. This candle indicates that now the dominance of sellers in the market has reduced and buyers have returned.
3. The pattern should form at the end of a downtrend
The most special thing about this pattern is that it should be formed at the very bottom of the chart. To find out, you should always test the next candle after forming this pattern to see if it breaks its high, meaning another green candle is formed which closes above the pattern. Then this will be considered a true pattern.
Ι Bullish Harami Pattern With Support & Ressistance
Using the bullish Harami candlestick pattern at support and resistance can be a very good strategy. Because support and resistance are such areas from where the possibility of market reversal is very high. Therefore let us understand their uses in detail:
1. With The Support
Support and resistance have great importance in trading. Support is a level at which a market becomes stable despite falling. This is a star where buyers become active after the market moves up, and it is a signal that there may be a reversal from the market’s level. Therefore, if you see a bullish Harami candlestick pattern at any support level, it is a strong signal that the market cannot go any lower from here, and there is a high possibility of a reversal.
2. With The Ressistance
Resistance is a level at which the market price stops falling. This is an area where sellers are active and enter the market. Therefore, if you ever see a bullish harami pattern passing near your resistance, you should be a little cautious and wait. Because this could be a false signal.
Ι Advantage And Disadvantage Of Bullish Harami Pattern

Let’s see some advantage and disadvantage of Bullish Harami Candlestick Pattern:
| Advantages | Disadvantages |
|---|---|
| 1. Early Reversal Signal: The Bullish Harami pattern gives an early indication of a potential trend reversal from a downtrend to an uptrend. | 1. Requires Confirmation: The pattern alone may not be reliable; it often needs a confirmation candle to validate the reversal. |
| 2. Easy to Identify: It consists of two candles and is relatively simple to spot on the chart, even for beginners. | 2. May Give False Signals: Sometimes the pattern can produce false reversals, especially in volatile markets. |
| 3. Helps in Risk Management: Traders can set a stop loss just below the support level or the low of the first candle to manage risk effectively. | 3. Weak Reversals: Even if the reversal happens, the following uptrend may be weak or short-lived. |
| 4. Can Be Used with Support Levels: The pattern becomes more reliable when it appears near a strong support level, increasing the likelihood of a trend change. | 4. Ineffective in Sideways Markets: In consolidating or sideways markets, this pattern may not work as effectively. |
| 5. Useful for Short-Term Traders: It helps short-term traders to catch small reversals in price trends, offering quick opportunities. | 5. Dependent on Market Context: Its effectiveness can diminish in broader market downtrends or without supporting indicators. |
Ι Conclusion
The bullish Harami candlestick pattern is a very important pattern. With the help of which a trader or investor can predict the possible reversal and decline in the market. However, it should also be kept in mind that no signal in the market is 100% accurate, so confirm other signals while using it. And you should always use stop loss while trading and after forming the bullish Harami pattern, you should always wait for its conformation candle. If you trade correctly and with discipline, the bullish Harami candlestick pattern can prove to be very profitable for you.
I hope that the above information will help you a lot. To get such valuable information related to share market and trading, subscribe to our blog Wealthpre .
ΙFrequently Asked Questions
what is bullish harami pattern
The bullish Harami candlestick pattern is a bullish pattern consisting of two candles, formed at the end of a downtrend, forming which there is a possibility of a reversal of a downtrend market. The first candle of this pattern is red and the second candle is green. The candle is a green candle which is engulf by the first red candle.
Does the Bullish Harami pattern only work at support levels?
No, although the Bullish Harami pattern works well at support levels, it is also effective when formed at the end of any uptrend.
What does (Harami) mean in the Bullish Harami pattern?
The meaning of (harami) in the bullish harami pattern is related to the shape of the pattern. Harami is a Japanese word that means (pregnant), the bullish Harami pattern is also shaped like a pregnant woman, hence the name Harami.

